The No-Loan Shell Game

How many loans would a no-loan school loan, if a no-loan school could give loans?
If you said the answer was zero, you'd be wrong. In reality it's over 20,000 families with over a billion dollars in parent loans outstanding (across the 28 institutions with publicized no-loan or "Free tuition" plans).
A couple of weeks ago Yale announced an expansion of "Free tuition" policies for students whose families are earning under 200k.
I don't want to pick on Yale specifically, but we're gonna use this as an occasion to talk about "Free tuition" and "No-loan Policies" which are pervasive at elite, well-endowed institutions.
It's my opinion that these things aren't what they're cracked up to be. Not because "It's Yale and real people don't care about Yale" (which is the most common criticism I see), or because maybe it's just glossy PR for their same old programs, but because they aren't doing what most people think they're doing.
In this very long post, I'll share the data that makes me think that, with two caveats:
1. I'm sure these programs have helped people get life-changing experiences
2. I'm sure there's another way to view these stats
So don't let me talk you out of anything.
To frame our conversation with what I think most reasonable people would assume these programs are meant to do:
Assumption 1: Increase the ability of low-income students to attend these institutions. You don't want smart kids missing great schools just because money is a factor.
Assumption 2: Decrease the cost that families bear by making it so they and their families don't have to take out loans once they're there.
Seems pretty straightforward, right?
Assumption 1: Opening Doors
Before we jump too much into the weeds, I want to establish a baseline.
In the past I've written about the challenges with evaluating higher education data — often times inputs get conflated with outputs, meaning students who come in the door end up driving what people think of as institutional quality.
So to discuss this topic earnestly, we're gonna compare the "no-loan" institutions alongside 25 of the institutions I like a lot — schools I've identified using a framework I put together around social mobility. I wrote about this in our first analysis.
These 25 schools were selected because they represent a wide cross-section of institutions who score high on our mobility index — spanning Cal State campuses, CUNYs, large urban publics, and Texas-system schools. They're the ones actually moving low-income students into the middle class at scale.
Going back to these no-loan schools and our first assumption.
In the announcement of this new program Yale's Jeremiah Quinlan stated "we reiterate and reinforce Yale's commitment to ensuring that cost will never be a barrier between promising students and a Yale College education."
So I don't think it's unreasonable to assume that an explicit aim of these policies is to increase the representation of low-income students at their institutions.
To evaluate this, we're going to look at Pell enrollment growth at these schools over time, compared to schools without such policies.
Here's what that looks like since 2008:
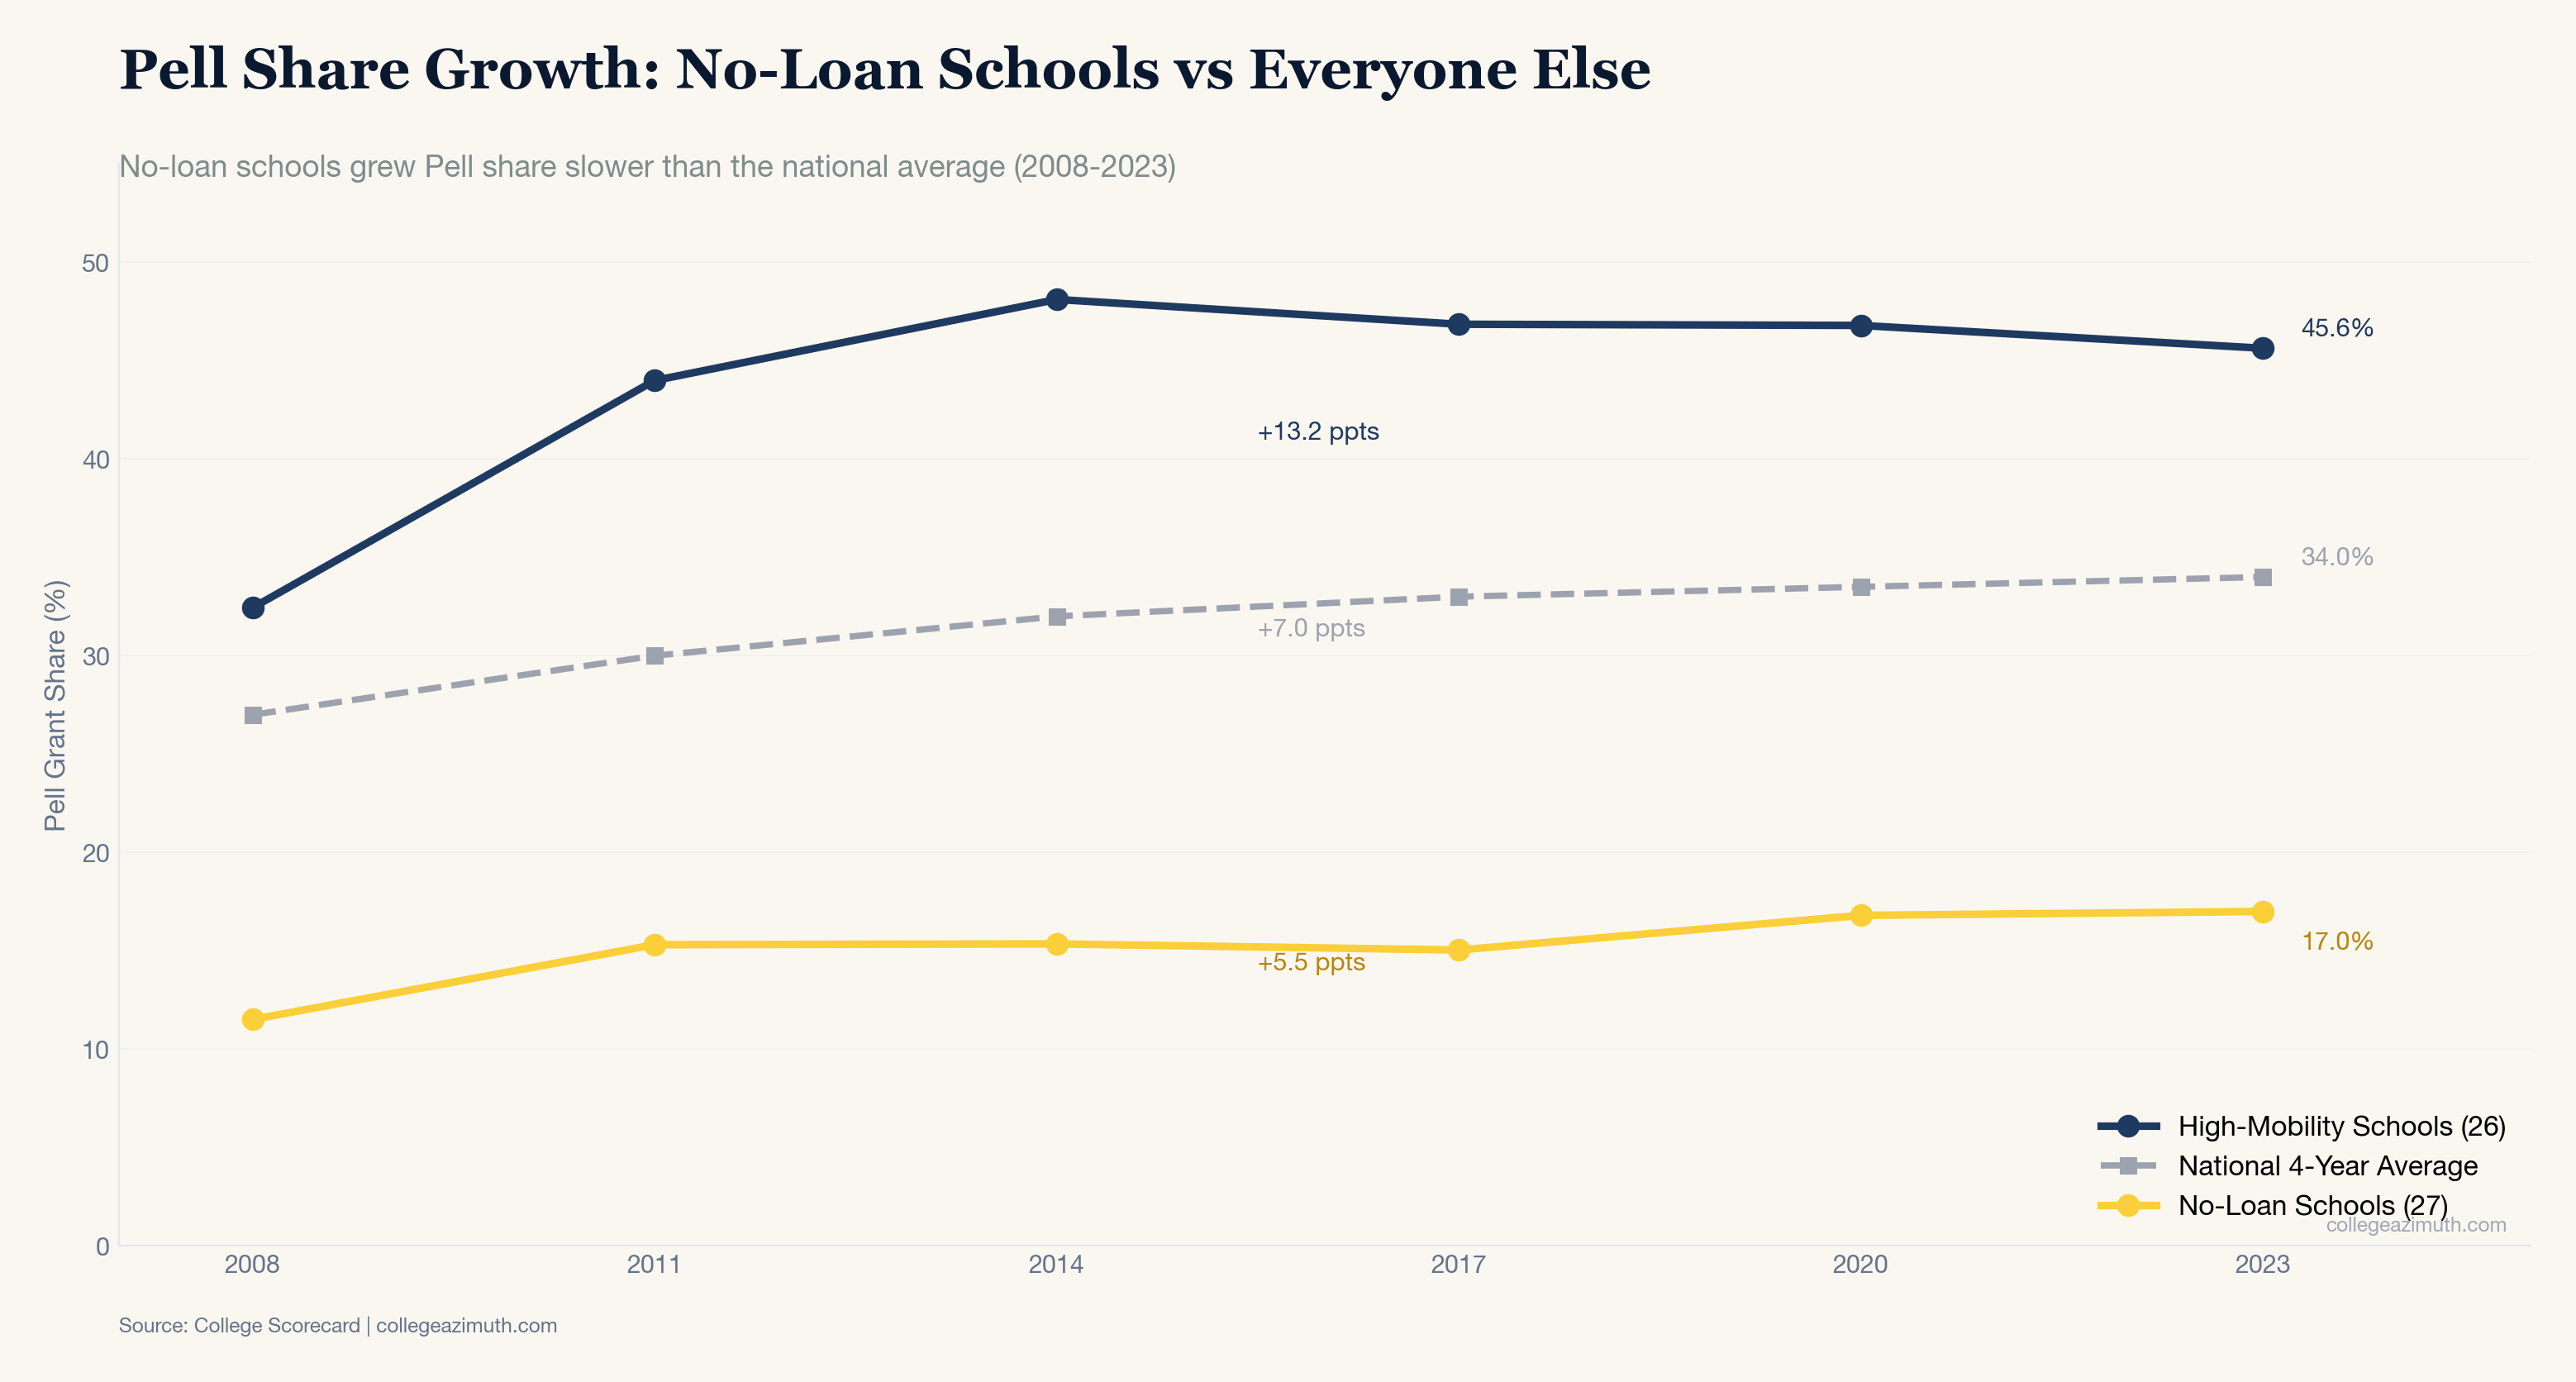
No-loan schools grew their Pell share slower than the national average. The high-mobility schools grew at nearly 2.5x the rate — and they started from a higher base.
Princeton did relatively well here (+6.5 ppts). UChicago grew enrollment by 32% but their Pell rate barely moved.
This one is fairly simple. Elite schools stayed elite. Some schools increased their Pell percent, some schools did not. None of them did so in any meaningful way. That's probably not that surprising, or even different than what some might expect. So let's move on to the actual part that deals with loans.
Assumption 2: Decreasing Family Debt
Okay, so these schools aren't necessarily growing low-income access. But at least "no-loan" means no loans, right?

When a school says "no loans in our financial aid packages," most people hear "families won't have to borrow." But that's not what it always means.
It means student loans aren't included in the aid package. The family contribution — what parents are expected to pay — still exists. And when families can't cover that contribution out of pocket, they borrow.
The Analysis of The Common Data Set: Looking at what schools actually report.
To understand what's actually happening at these schools, you need to look at the Common Data Set (CDS).
The CDS is a voluntary, standardized survey that colleges complete annually to provide consistent information about their institutions. It was created in 1998 through a collaboration between publishers — US News, Peterson's, the College Board — and higher education associations. Instead of answering different questions from every ranking publication, schools fill out one standard form. The CDS has become the backbone of most college rankings and guidebooks.
For most purposes, people use the CDS to compare admissions rates, test score ranges, and retention rates. What's less commonly used is Section H, which contains detailed breakdowns of financial aid by type: grants, scholarships, student loans, and for this purpose: parent loans.
This level of detail isn't available in the College Scorecard or IPEDS data that researchers typically use. The CDS separates "need-based" aid from "non-need-based" aid, and breaks out student loans from parent loans and other distinctions that get lost in aggregate federal datasets. It also is usually published every year and doesn't lag several years behind like some data points in the Scorecard.
Schools aren't required to disclose this information. A blank or $0 in the parent loans field could mean "we don't have parent borrowing" or "we don't report parent borrowing." We can't draw strong conclusions from what's missing but we can absolutely look at what schools do report.
There's also a reporting quirk you need to understand: Parent PLUS loans are federally classified as "non-need-based." This is a labeling artifact, not reality. When a school shows "$0 need-based parent loans," it doesn't mean low-income families aren't borrowing — it means the category doesn't capture them. A family earning $40,000 who takes out a Parent PLUS loan may show up in the "non-need-based" column.
To build our dataset, we manually downloaded CDS PDFs from each of the 27 "no-loan" institutions for multiple years (2017-2025), then extracted the Section H tables.
We also cross-referenced this with federal College Scorecard data, which tracks Parent PLUS borrowing at the institutional level using actual loan disbursement records. This is a relatively new thing, so we can't necessarily see trends over time which is why we pulled the CDS data. Between these two sources, we can see both what schools choose to report about themselves and what federal records show is actually happening.
Breaking Down the Data
Let's start with Yale. This is data I pulled out of their Common Data Sets over time.
| Year | Student Loans (Need) | Student Loans (Non-Need) | Parent Loans | Total Family |
|---|---|---|---|---|
| 2017-18 | $921,098 | $1,725,761 | BLANK | $2,646,859 |
| 2018-19 | $895,599 | $1,409,419 | BLANK | $2,305,018 |
| 2019-20 | $937,012 | $1,810,244 | $0 | $2,747,256 |
| 2020-21 | $937,012 | $1,810,244 | $0 | $2,747,256 |
| 2021-22 | $671,626 | $1,023,295 | $0 | $1,694,921 |
| 2022-23 | $597,162 | $6,688,258 | $5,475,399 | $12,760,819 |
| 2023-24 | $475,813 | $2,021,827 | $8,334,604 | $10,832,244 |
For four years (2019-2022), Yale reported exactly $0 in parent loans. By 2023-24, that number had grown to $8.3 million.
As this survey is voluntary, we don't know if this shift was a) a change in how they reported their numbers on this voluntary survey, b) a shift in how they awarded aid to focus more on parent loans, or c) something else which I'm sure is reasonable.
The Pattern Across All No-Loan Schools
Yale isn't an outlier. When we pulled CDS data for most of the "no-loan" schools, we found a clear pattern.
Here's the simplest way to see it — schools grouped by how much parent borrowing their own CDS filings show:
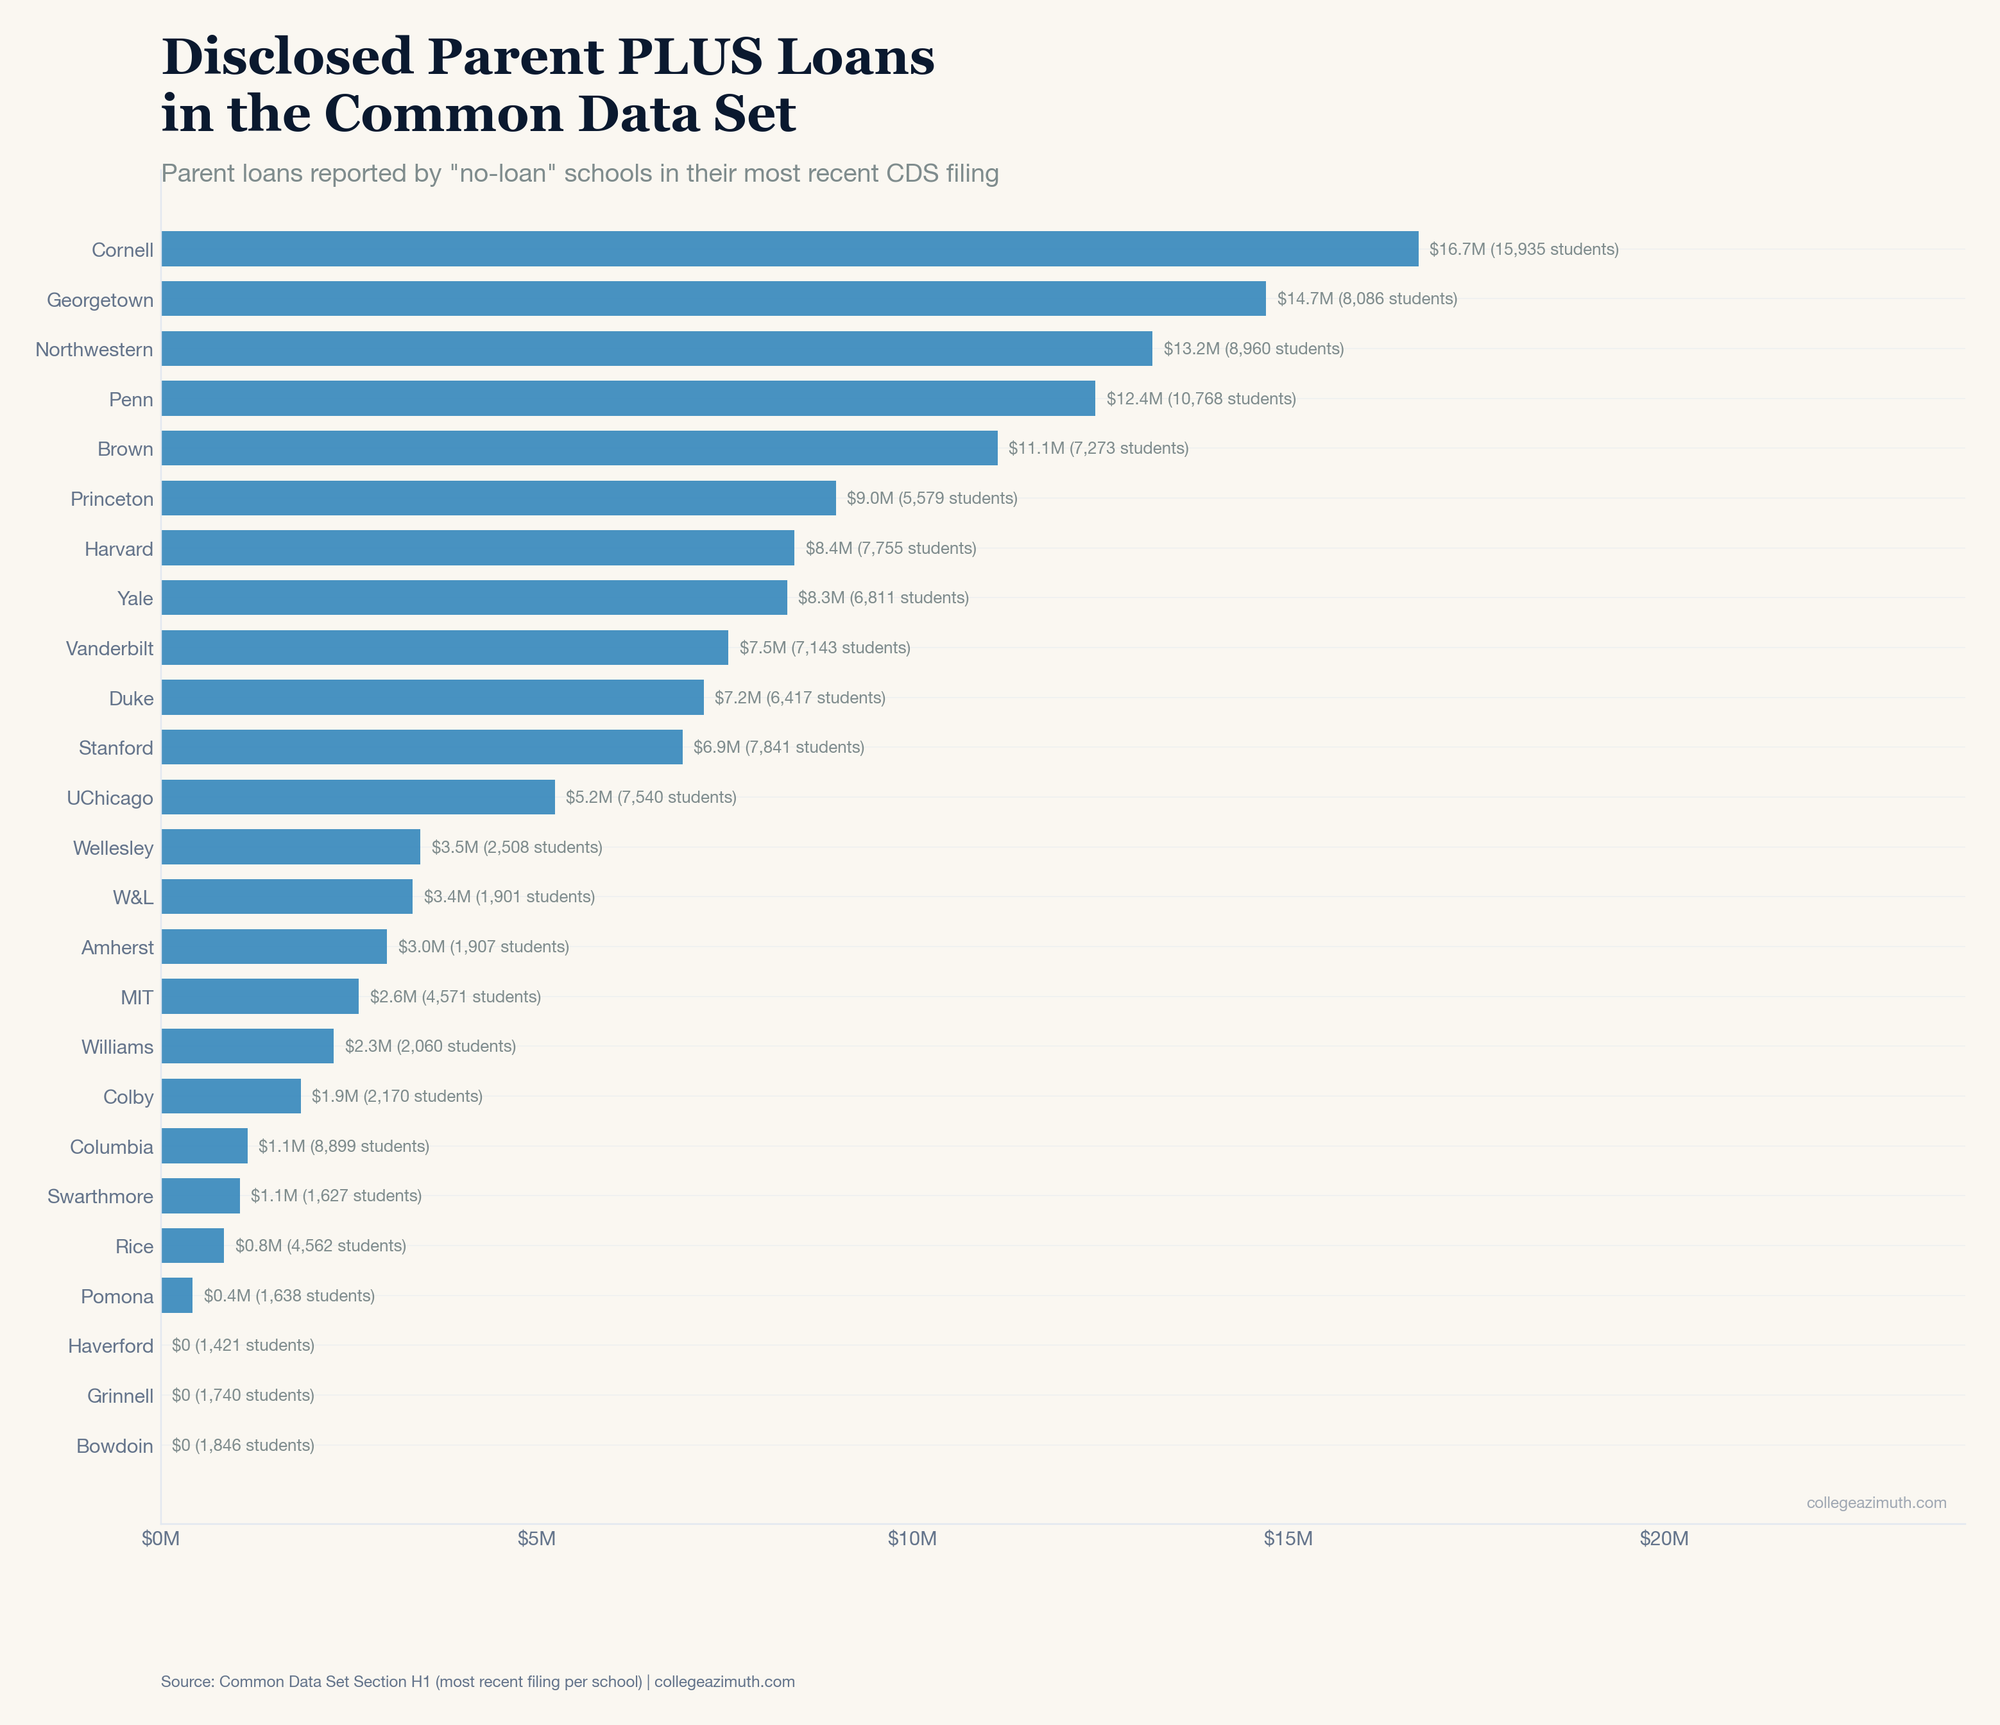
Only 3 of the "no-loan" schools report no parent loan data. The other 25 range from $500K to over $15 million per year. Here's what Parent PLUS loans look like over time:
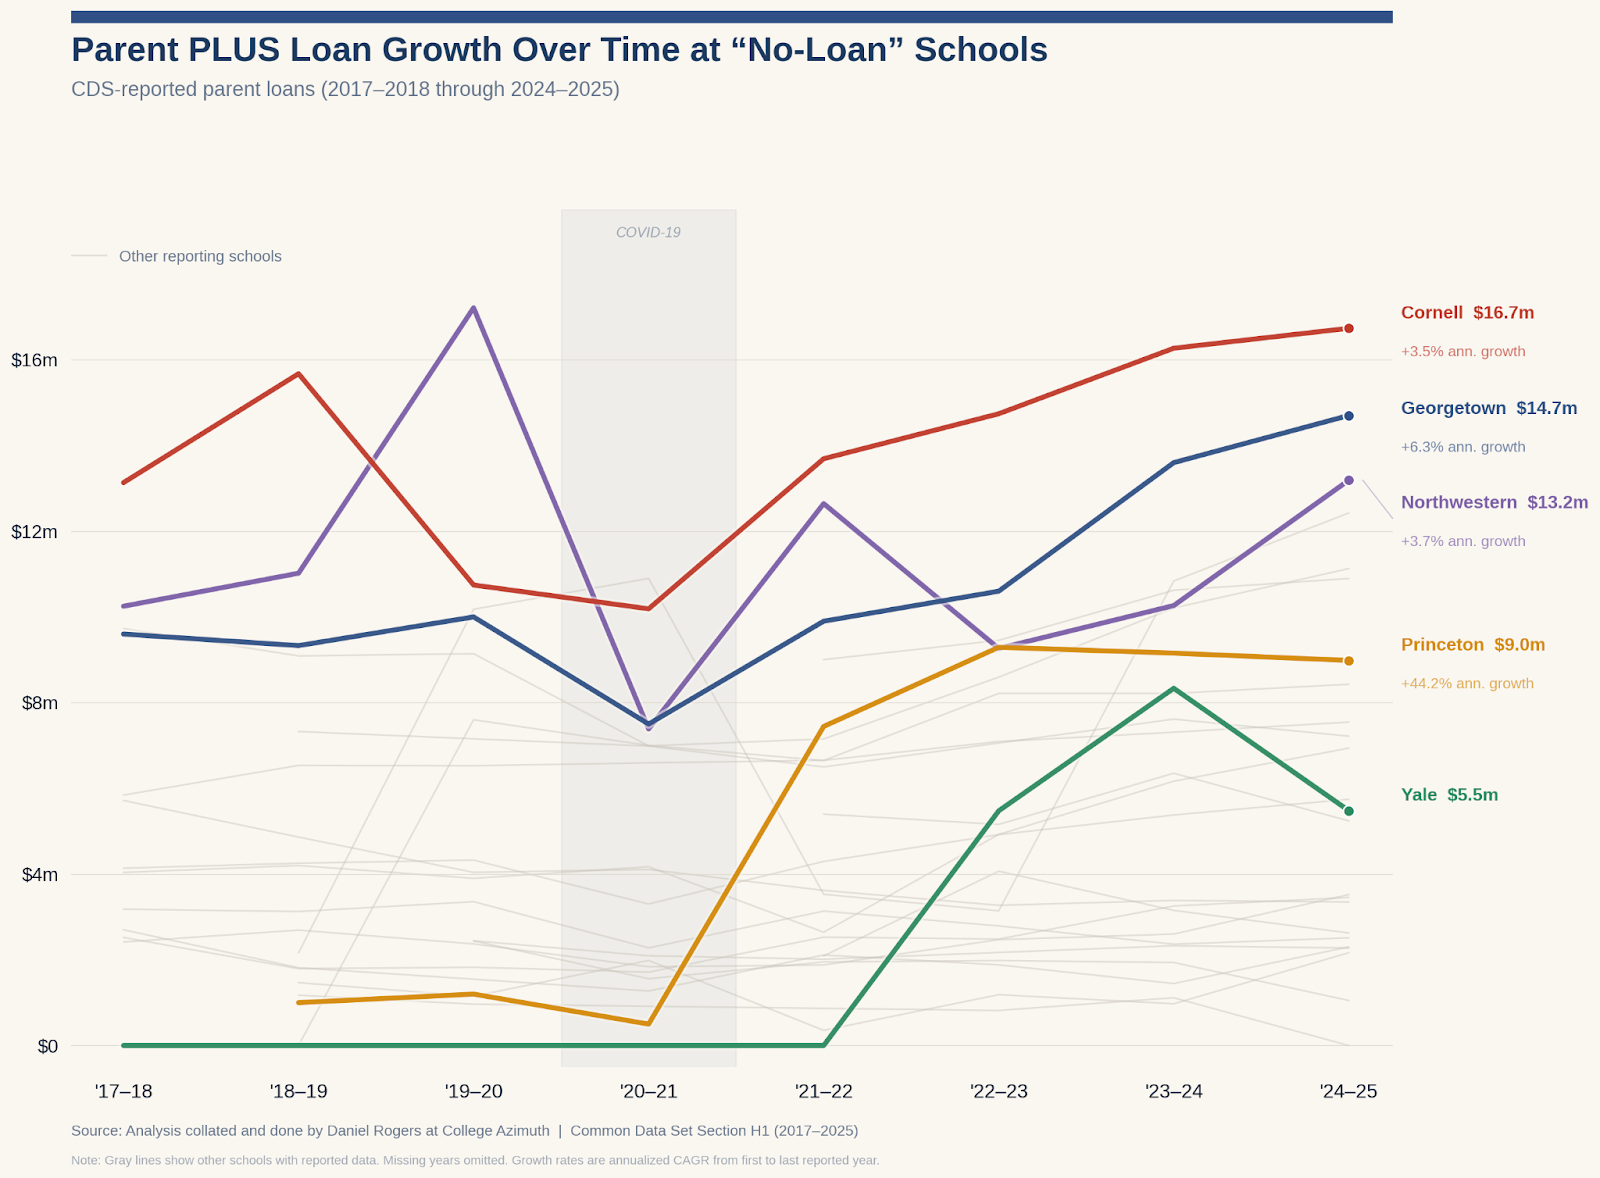
In this chart we see that for many of the schools parent loans continue to grow, and in some cases dramatically so. Princeton increased their disclosed parent loans dramatically while many others kept their lending growth stable over that time.
On the other side, only a handful of schools dropped their lending significantly. Rice very much so, while Swarthmore and Pomona both fell around 18%. But the overall trend was that almost every single dollar in "Student Debt" that was taken away was replaced by a dollar in parent loans.
Understanding the Reported Data
To unpack that further let's look at the example of another school: Stanford University.
The below is the breakdown of their "H1 Table" which includes the amount of loans taken out, and what that looks like over time.
| Stanford (CDS H1) | 2017 | 2024 | Change |
|---|---|---|---|
| Need-Based Student Loans | $1.6M | $2.1M | +32% |
| Non-Need Student Loans | $4.8M | $6.5M | +34% |
| Parent Loans | $4.0M | $6.9M | +72% |
| Total Family | $10.5M | $15.6M | +48% |
| Parent Share of Total | 39% | 45% | ↑ |
The H5 table gives us another snapshot by looking at what the graduating class took on in aggregate.
| Stanford (CDS H5 - Graduates) | 2017 | 2024 | Change |
|---|---|---|---|
| Students graduating with debt | 298 | 211 | -29% |
| Average student debt at graduation | $20,205 | $26,815 | +33% |
In 2013 Stanford's former President talked about Stanford's unwavering commitment to access which used "% of Students who have student debt" as one of their main metrics for success. We see here that the number of students who take out debt is decreasing, that's the headline.
However, the average debt those remaining students have has gone up significantly.
Also, the H5 tables conveniently do not include parent loans. So if we estimate it — multiplying the annual parent loan figure by four years — the estimated total family debt burden went up roughly 51%.
The "no-loan" policy is working for the student column. The debt isn't disappearing. It's moving to the parent column. And the reporting doesn't follow it there.
Looking at "Family Debt" Versus "Student Debt"
I've banged on for a few posts now that it's critical to think about family debt, versus just student debt. This is a part of the reason why. At these no-loan schools here is what that looks like:
| School | Year | Student Loans | Parent Loans | TOTAL | Parent Share |
|---|---|---|---|---|---|
| Cornell | 2024 | $26.3M | $16.7M | $43.0M | 39% |
| Northwestern | 2023 | $20.5M | $10.3M | $30.8M | 33% |
| Columbia | 2024 | $18.1M | $1.2M | $19.3M | 6% |
| Brown | 2019 | $9.4M | $9.1M | $18.5M | 49% |
| Harvard | 2023 | $6.8M | $8.2M | $15.0M | 55% |
| Vanderbilt | 2019 | $7.7M | $6.5M | $14.2M | 46% |
| Dartmouth | 2023 | $7.4M | $5.4M | $12.8M | 42% |
| Yale | 2022 | $7.3M | $5.5M | $12.8M | 43% |
| Princeton | 2023 | $1.9M | $9.2M | $11.1M | 83% |
| Rice | 2023 | $2.6M | $2.6M | $5.2M | 50% |
The broad point being that to understand trends in student borrowing, you have to account for both the amount going to the "family" and the burden that represents.
The Federal Records: Over a Billion in Outstanding Debt
So far, everything we've shown comes from the voluntary CDS report. Now let's look at what the federal loan records show about the total scale of parent borrowing at these schools.
The College Scorecard tracks Parent PLUS loans at the institutional level using actual disbursement records. Unlike the CDS, this isn't voluntary — it's drawn from the loans themselves. And importantly, Parent PLUS repayment starts when the loan is taken out, not after graduation. So what you're looking at here is residual debt — what families still owe after already making payments.
| School | Borrowers | Actual Outstanding | Avg per Borrower |
|---|---|---|---|
| Cornell | 2,553 | $130.4M | $51,062 |
| Georgetown | 1,369 | $92.6M | $67,667 |
| Johns Hopkins | 1,493 | $91.4M | $61,198 |
| Penn | 1,576 | $90.8M | $57,641 |
| Columbia | 1,395 | $75.9M | $54,422 |
| Brown | 1,133 | $73.8M | $65,179 |
| Northwestern | 1,055 | $60.7M | $57,563 |
| Duke | 951 | $57.9M | $60,881 |
| Vanderbilt | 1,064 | $56.4M | $52,986 |
| UChicago | 799 | $47.8M | $59,834 |
| Dartmouth | 580 | $39.3M | $67,711 |
| Stanford | 625 | $34.4M | $54,963 |
| Harvard | 589 | $33.5M | $56,846 |
| W&L | 561 | $32.8M | $58,547 |
| MIT | 516 | $30.3M | $58,708 |
| Yale | 572 | $29.4M | $51,407 |
| Davidson | 421 | $23.7M | $56,279 |
| Amherst | 375 | $22.1M | $59,057 |
| Rice | 366 | $19.3M | $52,778 |
| Colby | 308 | $19.1M | $61,891 |
| Bowdoin | 329 | $18.4M | $56,060 |
| Wellesley | 382 | $18.1M | $47,457 |
| Williams | 314 | $17.7M | $56,348 |
| Swarthmore | 289 | $15.4M | $53,357 |
| Haverford | 207 | $11.1M | $53,833 |
| Princeton | 147 | $8.5M | $57,616 |
| Pomona | 176 | $8.1M | $45,898 |
| Grinnell | 202 | $8.0M | $39,560 |
| TOTAL (28) | 20,347 | $1,167.0M | $57,356 avg |
That's the number from the top of this article. Over $1.1 billion in residual parent debt across 28 "no-loan" schools — over 20,000 families averaging $57,000 each. These families have been making payments — and they still owe this much. And this only captures federal Parent PLUS loans. It doesn't include private loans families may have taken out, which aren't tracked in the Scorecard. If a family refinanced their PLUS loan into a private loan, it would show up as paid off in the federal data — but the debt didn't go away.
This federal data also lets us fact-check the CDS.
Some schools report $0 in parent loans across all their CDS filings, every year we have data. But look at the table above. The Scorecard shows those schools have borrowers and millions in outstanding debt.
Because the CDS is voluntary, a $0 could mean "no parent borrowing" or "we don't report parent borrowing." The federal records make it clear which one it is.
These Aren't Just Rich Kids
The first instinct someone might have looking at the above data is "Well. Maybe those are wealthy parents who take out PLUS loans for tax or cash-flow reasons. That's not a problem — that's a choice."
Fair question. So let's look at who's actually borrowing.
The College Scorecard breaks down Parent PLUS borrowing by whether the student received a Pell Grant. Pell eligibility typically means family income under $60,000. There are exceptions to this, but that usually involves having a much bigger family. These are the families that "no-loan" policies claim to protect.
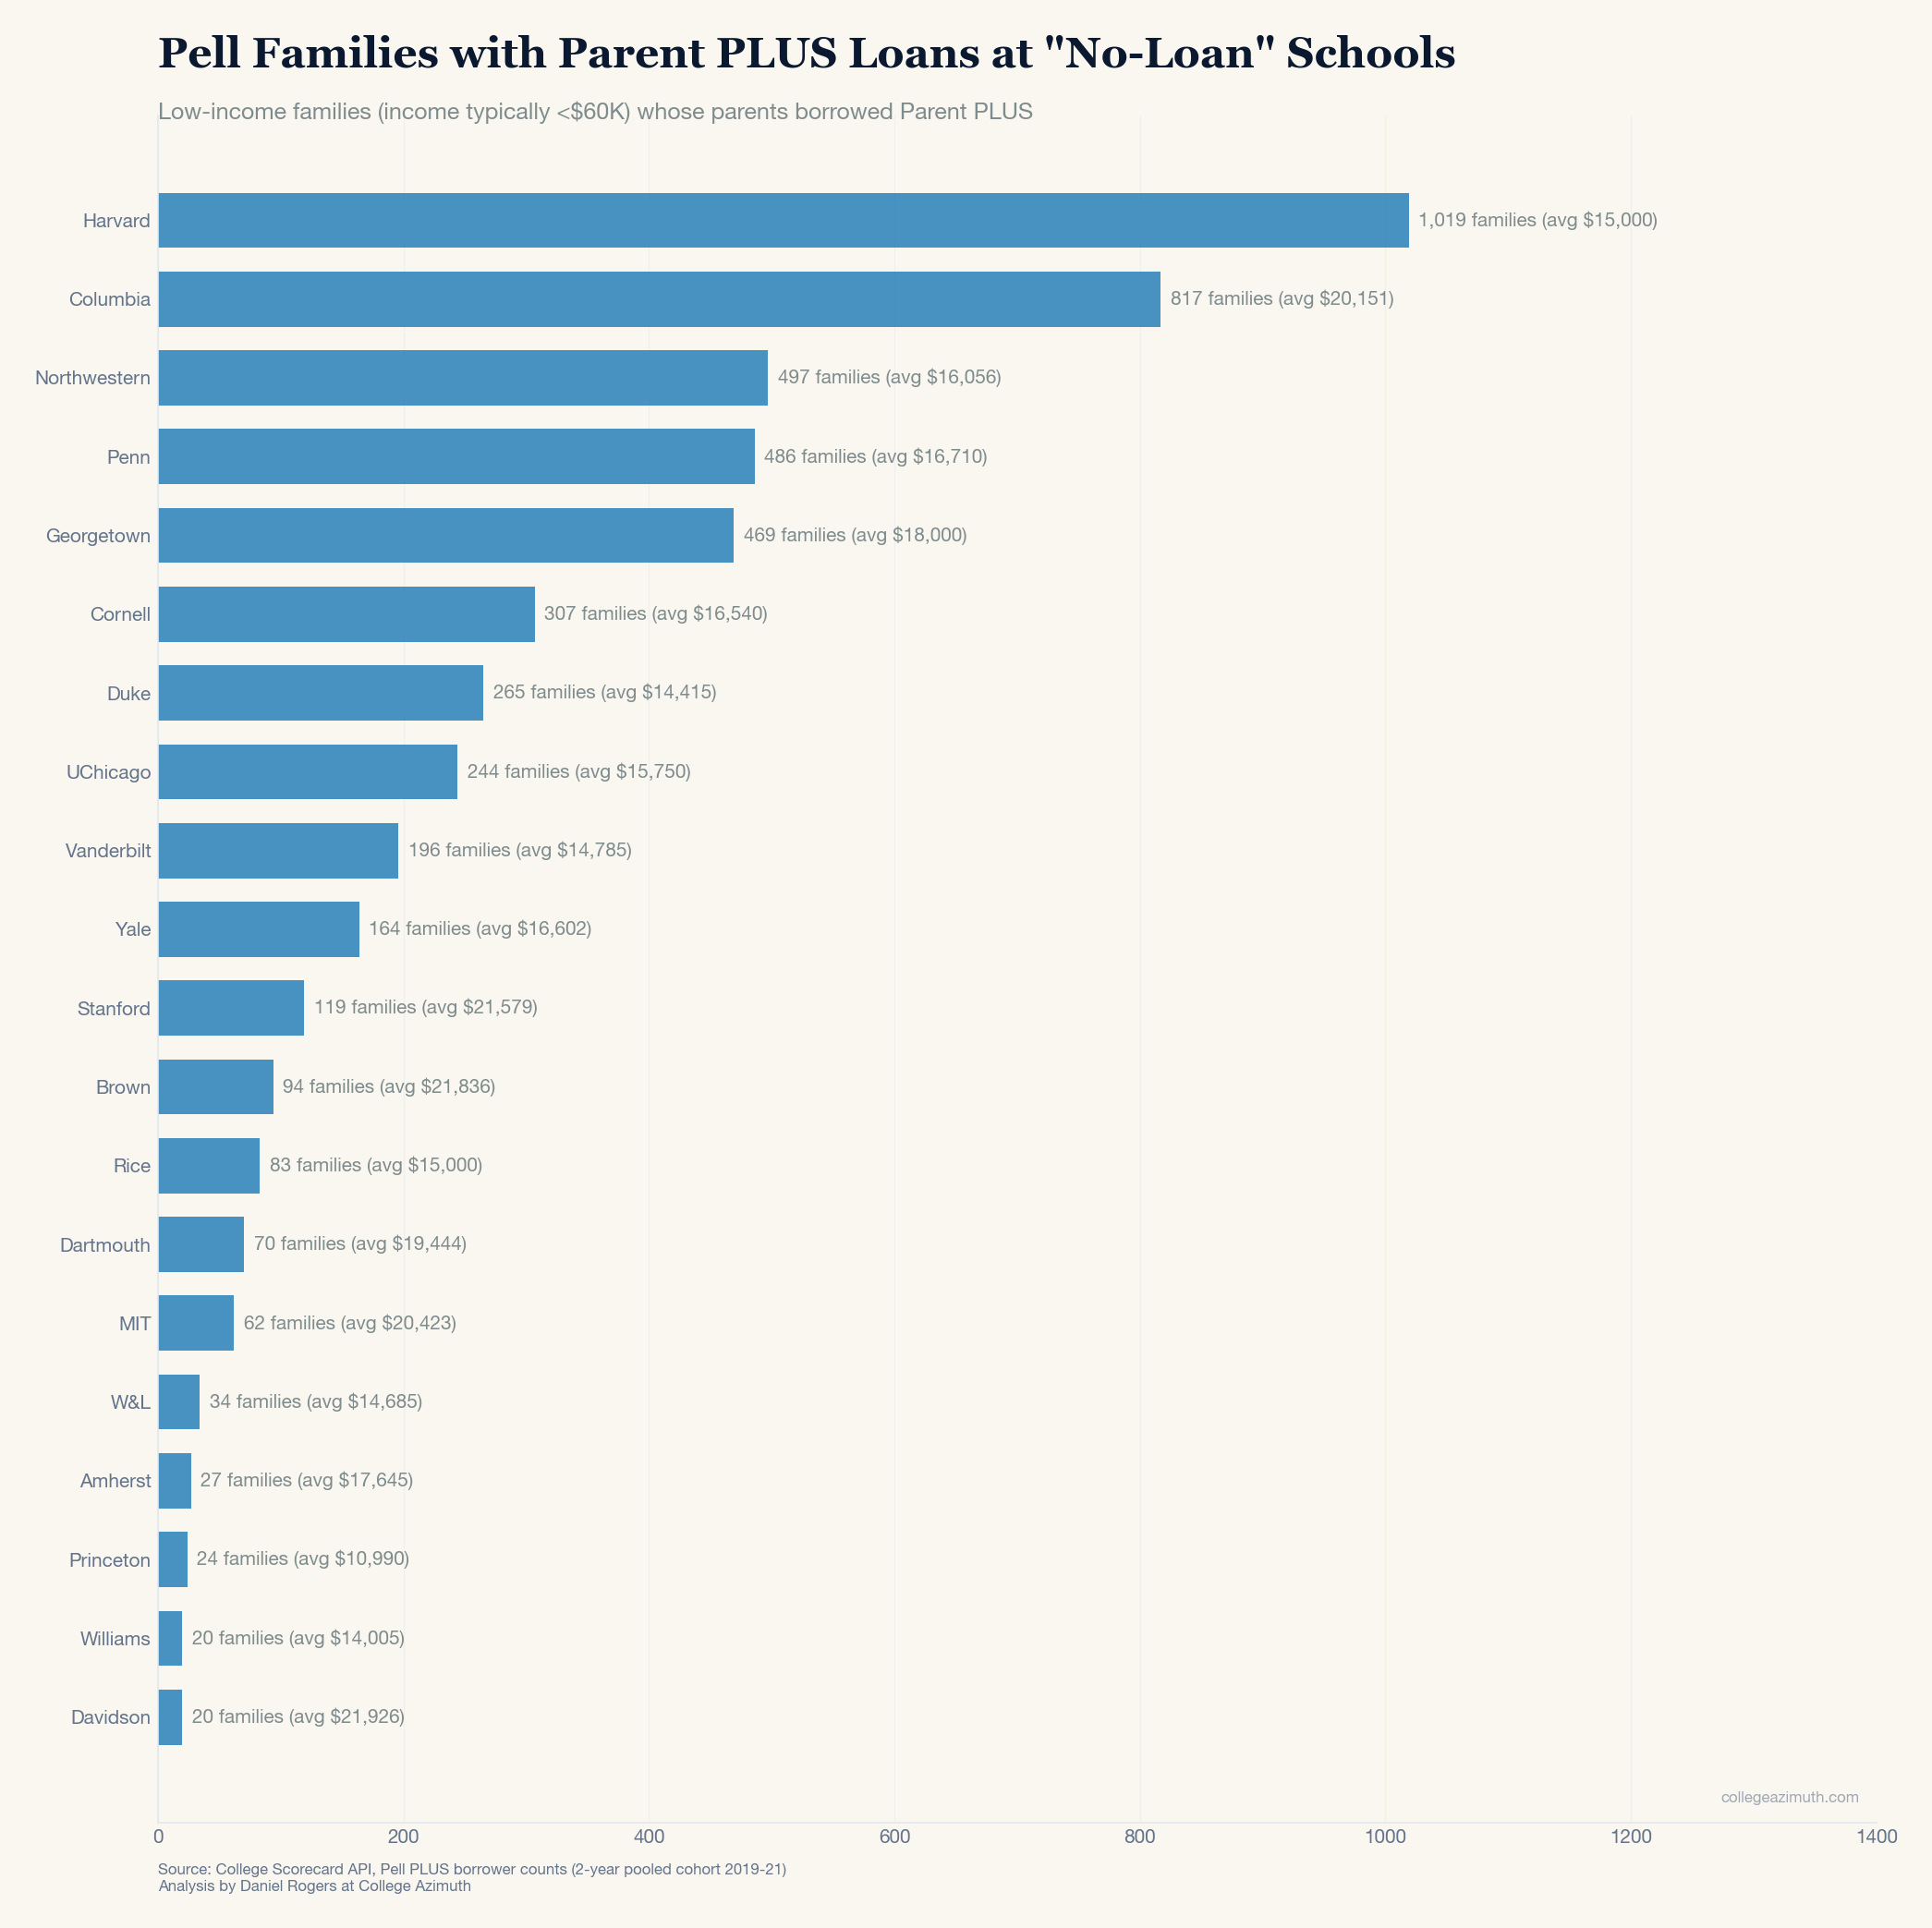
This is a pooled cohort of 2020-2021 graduates. It cross-references those who received a Pell Grant versus those who also had Parent PLUS loans.
| School | Pell Families with PLUS Loans | Avg Parent Loan Balance |
|---|---|---|
| Harvard | 1,019 | $15,000 |
| Johns Hopkins | 1,003 | $16,739 |
| Columbia | 817 | $20,151 |
| Northwestern | 497 | $16,056 |
| Penn | 486 | $16,710 |
| Georgetown | 469 | $18,000 |
| Cornell | 307 | $16,540 |
| Duke | 265 | $14,415 |
| UChicago | 244 | $15,750 |
| Vanderbilt | 196 | $14,785 |
| Yale | 164 | $16,602 |
| Stanford | 119 | $21,579 |
| Brown | 94 | $21,836 |
| Rice | 83 | $15,000 |
| Dartmouth | 70 | $19,444 |
| MIT | 62 | $20,423 |
| W&L | 34 | $14,685 |
| Amherst | 27 | $17,645 |
| Princeton | 24 | $10,990 |
| Williams | 20 | $14,005 |
| Davidson | 20 | $21,926 |
| TOTAL | ~6,100 families | |
| Weighted Avg | ~$17,000 | |
| Total Pell Parent Debt | ~$108 million |
The Scorecard also allows us to estimate the percentage of Pell families with PLUS loans:
| School | % of Pell Graduates with Parent PLUS |
|---|---|
| Columbia | 81.5% |
| Duke | 64.9% |
| Northwestern | 59.3% |
| Penn | 57.4% |
| UChicago | 44.7% |
| Vanderbilt | 29.7% — 1 in 3 |
| Georgetown | 26.7% — 1 in 4 |
| Yale | 25.2% — 1 in 4 |
| Rice | 22.6% |
| Dartmouth | 21.6% |
| Cornell | 21.2% |
| Brown | 19.5% |
| Stanford | 15.8% |
| MIT | 14.3% |
| Amherst | 13.1% |
| Williams | 11.3% |
| Princeton | 4.6% |
At 8 of 17 schools, more than 1 in 4 Pell graduates have parents with PLUS debt. At Columbia, it's more than 4 in 5. It's hard to estimate these numbers for every institution either because of small sample sizes or who ends up being included in these specific numbers (in the case of Harvard, I suspect it includes some extension school students but I do not know for certain).
The broad point being that the number of students who both have a Pell Grant AND a parent loan is much higher than one might assume from the outward-facing marketing on the subject.
Across all 28 no-loan schools, that's roughly 6,100 low-income families carrying about $108 million in parent debt. Keep those numbers in mind — we're going to come back to them.
This Isn't a Fluke
You might wonder: "Is this a one-year snapshot? Maybe it was an unusual year."
The Scorecard has Pell-specific Parent PLUS data for four years: 2017, 2018, 2019, and 2020. Here's what the trend looks like:
| School | 2017 | 2018 | 2019 | 2020 | 4yr Change |
|---|---|---|---|---|---|
| Harvard | 892 | 907 | 926 | 1,019 | +14% |
| Columbia | 649 | 684 | 765 | 817 | +26% |
| Northwestern | 414 | 428 | 467 | 497 | +20% |
| Yale | 136 | 148 | 161 | 164 | +21% |
| Dartmouth | 51 | 64 | 80 | 70 | +37% |
| Rice | 62 | 59 | 73 | 83 | +34% |
| Duke | 348 | 290 | 256 | 265 | -24% |
| MIT | 72 | 57 | 51 | 62 | -14% |
| Princeton | 24 | 31 | 30 | 24 | 0% |
14 institutions increased the number of Pell families who took out parent loans from 2017 to 2020. These patterns are persistent, not anomalous. Harvard and Johns Hopkins have had 900+ Pell families with parent loans for all four years on record.
We should acknowledge that Princeton has kept this relatively small, while MIT and Duke and others have seemingly done a good job of limiting the number of Pell students who end up taking out parent loans. However, the trend in aggregate is there.
How Do the Comparison Schools Stack Up?
Now let's bring back the high-mobility schools we introduced earlier — the ones that are actually moving low-income students into the middle class.
Obviously, none of these schools are cheap. The cost of education is going up for many reasons, good and bad. But what we see is that institutions who serve more low-income students and who don't necessarily have the luxury of high-income students to offset losses are doing a good job at keeping the family borrowing burden low.
| Metric | No-Loan (28) | High-Mobility (25) |
|---|---|---|
| Pell Families with Parent Loans | 6,095 | 29,942 |
| Avg Pell Share | 17% | 54% |
| Avg Parent Loan Balance (Pell) | $16,600 | $11,270 |
High-mobility schools serve nearly 6x more Pell families who borrow — and those families end up with $5,330 less debt each. These schools have 3x the Pell share, far less endowment money, and still manage lower family borrowing.
Here's what that looks like school by school. All 25 high-mobility schools:
| School | Pell % | Pell Families with Parent Loans | Avg Parent Loan |
|---|---|---|---|
| Arizona State | 30% | 7,818 | $15,638 |
| Georgia State | 50% | 3,763 | $12,000 |
| Rutgers Newark | 56% | 2,994 | $15,627 |
| UNLV | 40% | 1,815 | $14,971 |
| UCF | 33% | 1,602 | $11,995 |
| FIU | 40% | 1,535 | $11,392 |
| CSU Long Beach | 49% | 844 | $11,434 |
| CSU Fullerton | 47% | 831 | $12,000 |
| CSU Northridge | 56% | 762 | $10,000 |
| CUNY Hunter | 55% | 735 | $14,000 |
| UT El Paso | 61% | 704 | $8,528 |
| UT Rio Grande Valley | 64% | 688 | $6,766 |
| CUNY Lehman | 61% | 612 | $9,000 |
| CUNY Brooklyn | 56% | 540 | $13,813 |
| CSU San Bernardino | 57% | 523 | $10,557 |
| UH Downtown | 52% | 501 | $9,000 |
| CUNY Queens | 48% | 490 | $12,904 |
| CSU Los Angeles | 66% | 470 | $10,462 |
| Texas A&M Kingsville | 55% | 449 | $9,141 |
| CUNY John Jay | 59% | 436 | $12,821 |
| CSU Dominguez Hills | 61% | 418 | $9,287 |
| CUNY City College | 60% | 407 | $12,600 |
| CUNY Baruch | 55% | 405 | $14,840 |
| CSU Bakersfield | 61% | 333 | $10,355 |
| CSU Stanislaus | 55% | 267 | $9,000 |
| HIGH-MOBILITY TOTAL | 54% avg | 29,942 | $11,270 avg |
Georgia State serves 3,763 Pell families who borrow at a median of $12,000. Yale serves 164 at $16,602 — $4,600 more per family. FIU serves 1,535 at $11,392. Harvard serves 1,019 at $15,000 — $3,600 more per family.
UT Rio Grande Valley serves students from one of the poorest regions in the country — 64% Pell — and their families borrow $6,766. Less than half what Yale's Pell families borrow.
So What Does This All Mean?
I could sit here and tell you what I think this means, but in reality I think it's best if we let the students of these institutions tell it:
Yale Daily News (2015): Tyler Blackmon, staff columnist, called it plainly:
"Yale's insistence that it does not require undergraduates to take out student loans is a bald-faced lie. By graduation, nearly half of students receiving financial aid at Yale will need to take out loans to cover gaps in their education funding."
Daily Pennsylvanian (2016): Investigating Penn's "all-grant" policy:
"32% of Penn graduates still had student debt despite the 'all-grant' policy... This makes us wonder: who, exactly, is the policy for?"
Penn eventually rebranded from "no-loan" to "all-grant" — same policy, more honest name.
Daily Princetonian (2024): On Princeton suing graduates for defaulted loans:
"The University sued recent graduates over $6,000-$7,000 in defaulted institutional loans — while sitting on a $34 billion endowment... If we forgave these loans entirely, it wouldn't even be a rounding error."
The Amherst Student (2020): Two students compared their situations:
"One of us is on track to graduate with $135,000 in student loan debt. The other will graduate with $27,000 of debt in his name and $110,000 in his parents'."
The Dartmouth (2019): On the gap between policy and reality:
"I had multiple conversations with Financial Aid… I don't think they lied to me. It was more that I couldn't understand what they were telling me because I didn't know the vocabulary."
The Stanford Daily (2019): On financial aid gaps:
"The real question is why these policies took so long when schools like Stanford have had the resources for decades."
The Brown Daily Herald (2024): On parent loans and the families they burden:
"Federal loans take advantage of desperate or uneducated families, leaving them in decades of severe debt."
"If a family is desperate enough to take out these loans, they have a higher chance of missing a payment, which could destroy their credit, put their mortgage in jeopardy and destabilize the future of their other children. Similar to payday companies, these loans tend to burden low-income families — and, disproportionately, low-income families of color."
I'm not sure what else I could say that hasn't already been said here by these students. Ostensibly these articles were fueled by students who realized what was happening to them and their families and felt the need to speak up.
If you were in their shoes it might be easy to think that these are isolated, maybe even one-off examples for the students themselves or the institutions but the reality is that it's not in either case.
An Important Technical Note
There's something worth understanding about how this works. When a school says "no loans in our financial aid package," that's a specific, technical claim. It means the aid package — the offer letter the school sends — doesn't include loans. But what most people hear is "no debt."
| What They Say | What Most People Hear | What Actually Happens |
|---|---|---|
| "No tuition" | "It's free" | Room, board, and fees still cost $20K+ |
| "No loans in aid package" | "No debt" | Parents can still take PLUS loans |
| "All families under $200K" | "Everyone's covered" | Only covers "demonstrated need" |
| "100% of need met" | "Fully covered" | "Need" formula excludes parent borrowing |
These are not mistakes. Schools must certify student enrollment and cost of attendance for every Parent PLUS loan disbursed. They can choose to limit or refuse PLUS certification. They know exactly who is borrowing and how much. This is not happening behind their backs. They know, and they still choose to put out the PR saying one thing where most people would probably assume something else.
The mechanics are straightforward:
- School calculates "family contribution" based on income and assets
- Family can't actually pay that amount
- Parents take out PLUS loans to cover the gap
- School reports "no loans in aid packages" — technically true
- Family has debt anyway
These Are Not "Good" Loans
Parent PLUS loans have no cap based on ability to repay. A family making $30,000 can be approved for $100,000 in loans. The Dallas Fed called it "virtually unlimited." The interest rate is ~8.05% (2024-25) with a 4.228% origination fee. There are no income-based repayment options. No subsidized interest during school.
The burden falls hardest on the most vulnerable families. The Century Foundation found that 42% of Black Parent PLUS borrowers have zero Expected Family Contribution — meaning they're the poorest families in the program. Ten years into repayment, these families still owe 96% of their original principal.
The no-loan policy moves debt from the student's name to the parent's name. It moves the liability from the school's reported metrics to the family's balance sheet.
A Discussion About Making Hard Choices
I want to tell you a story about hard choices.
In prior stories I've talked about how I had to beg my grandma to co-sign on a loan. I don't explain why that was the case, even though in real life people have grilled me on it. So here's that part of the story:
This is a story in two parts.
The first part is simple. I went to school before the 9/11 GI Bill, so I only got a housing stipend and some books covered. It was helpful, but not as helpful as it is today. They passed the 9/11 GI Bill—buffing this program substantially—as soon as I graduated. C'est la vie.
The second part is that my school front-loaded a lot of federal aid—including federal loans and my Pell Grant—into my first semester, leaving me with a huge gap in my second.
It's important you understand that I had a meticulous plan. I got paper copies of the student bulletin and mapped out every single course I needed to take. When I went to Iraq in the fall of 2004, I was able to knock out about 7 courses I didn't see much value in taking—through online courses while I was in Mosul doing combat shit. (Mind you, this is well before smartphones. Online courses weren't really a thing.)
I was also working 3 jobs when I first got there: the library, a full-time internship, and the Army Reserve (which kicked in some tuition assistance too).
So I'd like to believe I did everything humanly possible to make sure I had a great plan. However, damned as I am, it never occurred to me that the aid I got coming in the door wasn't the aid I'd get in subsequent semesters. But that would be ridiculous, right?
I guess I wasn't cynical enough to realize: once you're in—once you've done all the things I did (or other more reasonable people do) to get there—it's hard to talk yourself out of it. These choices are sticky. Institutions make the choices as appealing as they can be up front, knowing that once you're there, the next option would have to be substantially better for you to consider switching.
I share that because I know what hard choices look like. And I know what it feels like when the institution you trusted doesn't hold up its end. The families in this data are making hard choices too. Parents are choosing to take on large amounts of debt for their children to go to college. Students are doing so too on the presumption that once they get a better life they'll be able to help out.
On the other side of this, I'm sure people will say that institutions are giving a lot, and doing everything they can for these students. There is some truth to that, but I want to put these numbers into context.
To eliminate all Parent PLUS debt for Pell families across all of these schools: - Cost: ~$108 million - Combined endowments: $324 billion - As percentage of endowment: 0.03% - Days of endowment returns to cover it: about 2 (at 5% annual return)
Yale has $40.7 billion in endowments. Eliminating Parent PLUS debt for all 164 of its Pell families would cost $2.7 million — or 0.007% of the endowment.
I'm sure these schools have their reasons for all of this. I'm sure there's a story they can and will tell about it.
But the simple point I will make is that whatever those reasons are, this is a choice they are making, and not really that much of a hard one.