What the Graduation Rate Doesn't Count — And Why It Matters
The standard graduation rate excludes most students. Federal data shows the real number is 28 points higher at schools like UTRGV. Here's what the metric actually measures — and what it misses.

I got some feedback the other day asking me why our rubric liked an institution so much.
"University of Texas Rio Grande Valley is ranked #2 in Texas but has a sub-50% grad rate — what good is looking at earnings if most students don't graduate?"
It's a genuinely good question and the post today is about unpacking why that is, and to highlight how I think about some of these things. As usual, let's start with a story.
As I may have mentioned, I joined the Army out of high school. Did some classes while I was in, transferred credits around, and eventually figured out a way to keep going. The more granular version of that story is that in October 2002, I re-enlisted for an additional two years. However, instead of taking the bonus, I took a seldom-used perk that let me attend classes locally while still on active duty. So for 6 months my "job" was to drive down to Tacoma Community College from Fort Lewis and take classes. I still had PT and any after-hours shifts, but otherwise I was a student.
After that ended I kept going through a school (Pierce College) that worked with the base and ran a robust correspondence program. You'd enroll, get a book, and they'd tell you the standard for passing, a proctored exam, a paper, whatever it was and you had a window to complete it. In practice this meant I could knock out a course in two weeks if things were quiet, or put it down for a month if we went into the field and pick it back up when we got home.
When I found out I was going to Iraq, I reached out to see if I could keep going that going online which in 2004 was still something of a novelty. They said yes. So, while I was deployed I knocked out something like seven courses. I'd order the books from what was then a startup called Amazon, or we'd buy bootleg DVDs for my film criticism course — which, for the record, knocked out an arts requirement.
That's how I like to tell people I did my sophomore year of college.
I'm genuinely grateful for every institution that made that possible. There's no version of this story where I get a degree without that kind of flexibility. And yet by the metrics most people use to evaluate colleges, I was a liability. I never finished a formal program at these schools, so I counted as a dropout in that period where I wasn't formally enrolled in a program. My total time to graduation was around eight years, which looks terrible on the standard measure for graduation.
The schools that helped me the most would be penalized for it in any traditional college ranking or evaluation.
Which brings me back to UTRGV and why I think its important to look beyond typical graduation rates.
Evaluating what really counts.
The standard graduation rate that is cited in most places measures the share of first-time, full-time students who graduate within six years. It excludes part-time students, transfer students, and anyone who takes longer than six years. This presumes a "standard" student going through a "standard" route through college.
The reason I counted as a dropout at half those schools is simple: I didn't graduate from them. I used them. I took what I needed, moved on, and eventually finished somewhere else. This is how a lot of people actually navigate higher education, even if the basic metrics don't account for it.
The student who goes to Austin Community College for two years to save money, then transfers to UT. The working professional taking two night classes a semester to finish a degree they started at 22. The adult who had to stop for reasons good and bad and is now going back. None of them fit the mold the standard graduation rate is trying to measure.
To really evaluate whether a university is doing its job, you have to start with a clearer sense of what the job actually entails. At an institution where everyone is expected to be a first-time, full-time student who graduates as quickly as possible, the graduation rate might be a reasonable proxy. But for schools that serve a more diverse population (which is a lot) you need something different.
The good news is that the Department of Education has already done this work. In 2015 they built a framework called Outcome Measures — and at some point quietly added it to the College Scorecard without much fanfare. No big press release. It's just there if you know to look. In 2024, NCES actually had to commission a formal study asking why no ranking, no newsroom, and no college website had picked it up. The agency that built the better tool had to formally investigate why nobody was using it. So that's what we're going to do today.
Outcome Measures breaks student outcomes into four buckets: awarded a degree, transferred to another institution, still enrolled, and no outcome. It also extends the window from six years to eight.
That last bucket — "no outcome" — is the one everyone pictures when they hear the word dropout. No degree, no transfer, no enrollment after eight years. That's a real thing and it happens. But it's one of four categories, not the default explanation for everyone who didn't graduate on time. The working adult still taking classes five years in isn't a dropout. The student who transferred to a school that fit them better isn't a dropout. The traditional graduation rate can't tell the difference. Outcome Measures can.
So how do we measure outcomes?
Let's build the picture for UTRGV one layer at a time.
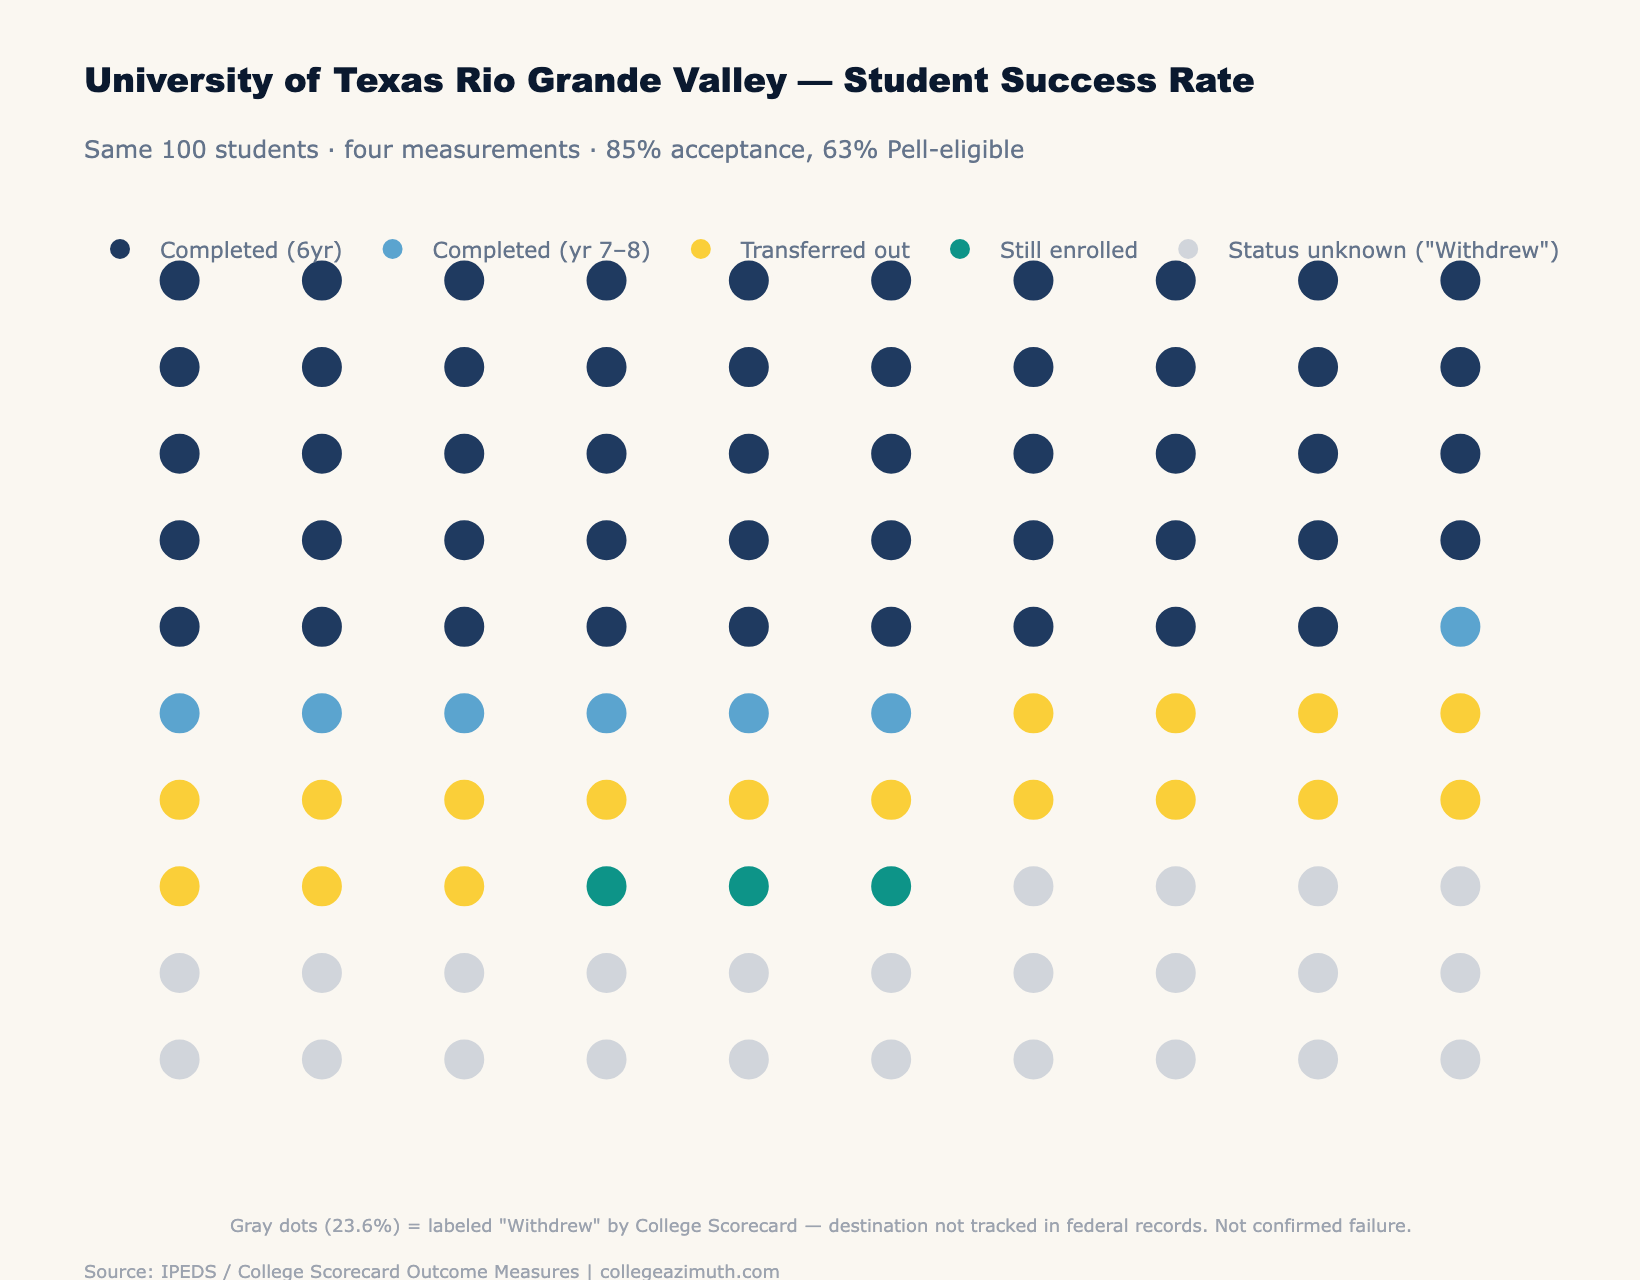
Start with what the rankings show: a 49.3% six-year graduation rate. Fewer than half of students finishing in six years. Admittedly not great.
Now just expand the window to eight years and include all students — not just first-time, full-time. That's what the College Scorecard quietly shows if you scroll past the headline number. Suddenly it's 59%. Same school, same students, same outcomes. We just stopped cutting people off at six years and started counting part-time students.
Now add the students who transferred out and enrolled somewhere else. Another 15-17%. They didn't graduate from UTRGV — but they're not the same as students who stopped out.
Now add the students still actively enrolled at UTRGV after eight years. Another 3%.
| How you measure it | Rate | What changed |
|---|---|---|
| Traditional IPEDS (FTFT, 6yr) | 49.3% | What rankings show |
| All students, 8yr | 59% | Broader cohort + longer window |
| Add transfers | ~74% | Count students who enrolled elsewhere |
| Add still enrolled | ~77% | Count students still actively working on it |
That's a 28 percentage point swing — a 57% increase in the metric — just by using the data that already exists in the federal database.
The remaining 23% left UTRGV and didn't re-enroll at another institution within eight years at least not one that reports to federal records. The Scorecard calls this "Withdrew." That may be the right word for some of them. But even if you take the worst-case view even if every single one of those students stopped out you're still looking at a 77% positive outcome rate at a school with an 85% acceptance rate and 63% Pell share. The traditional graduation rate calls that a failing grade. The full data set looks somewhat different.
Zooming out to the macro story
UTRGV is one example. Let's zoom out and look at how outcomes change when you account for the full spectrum of what people actually do within higher education.
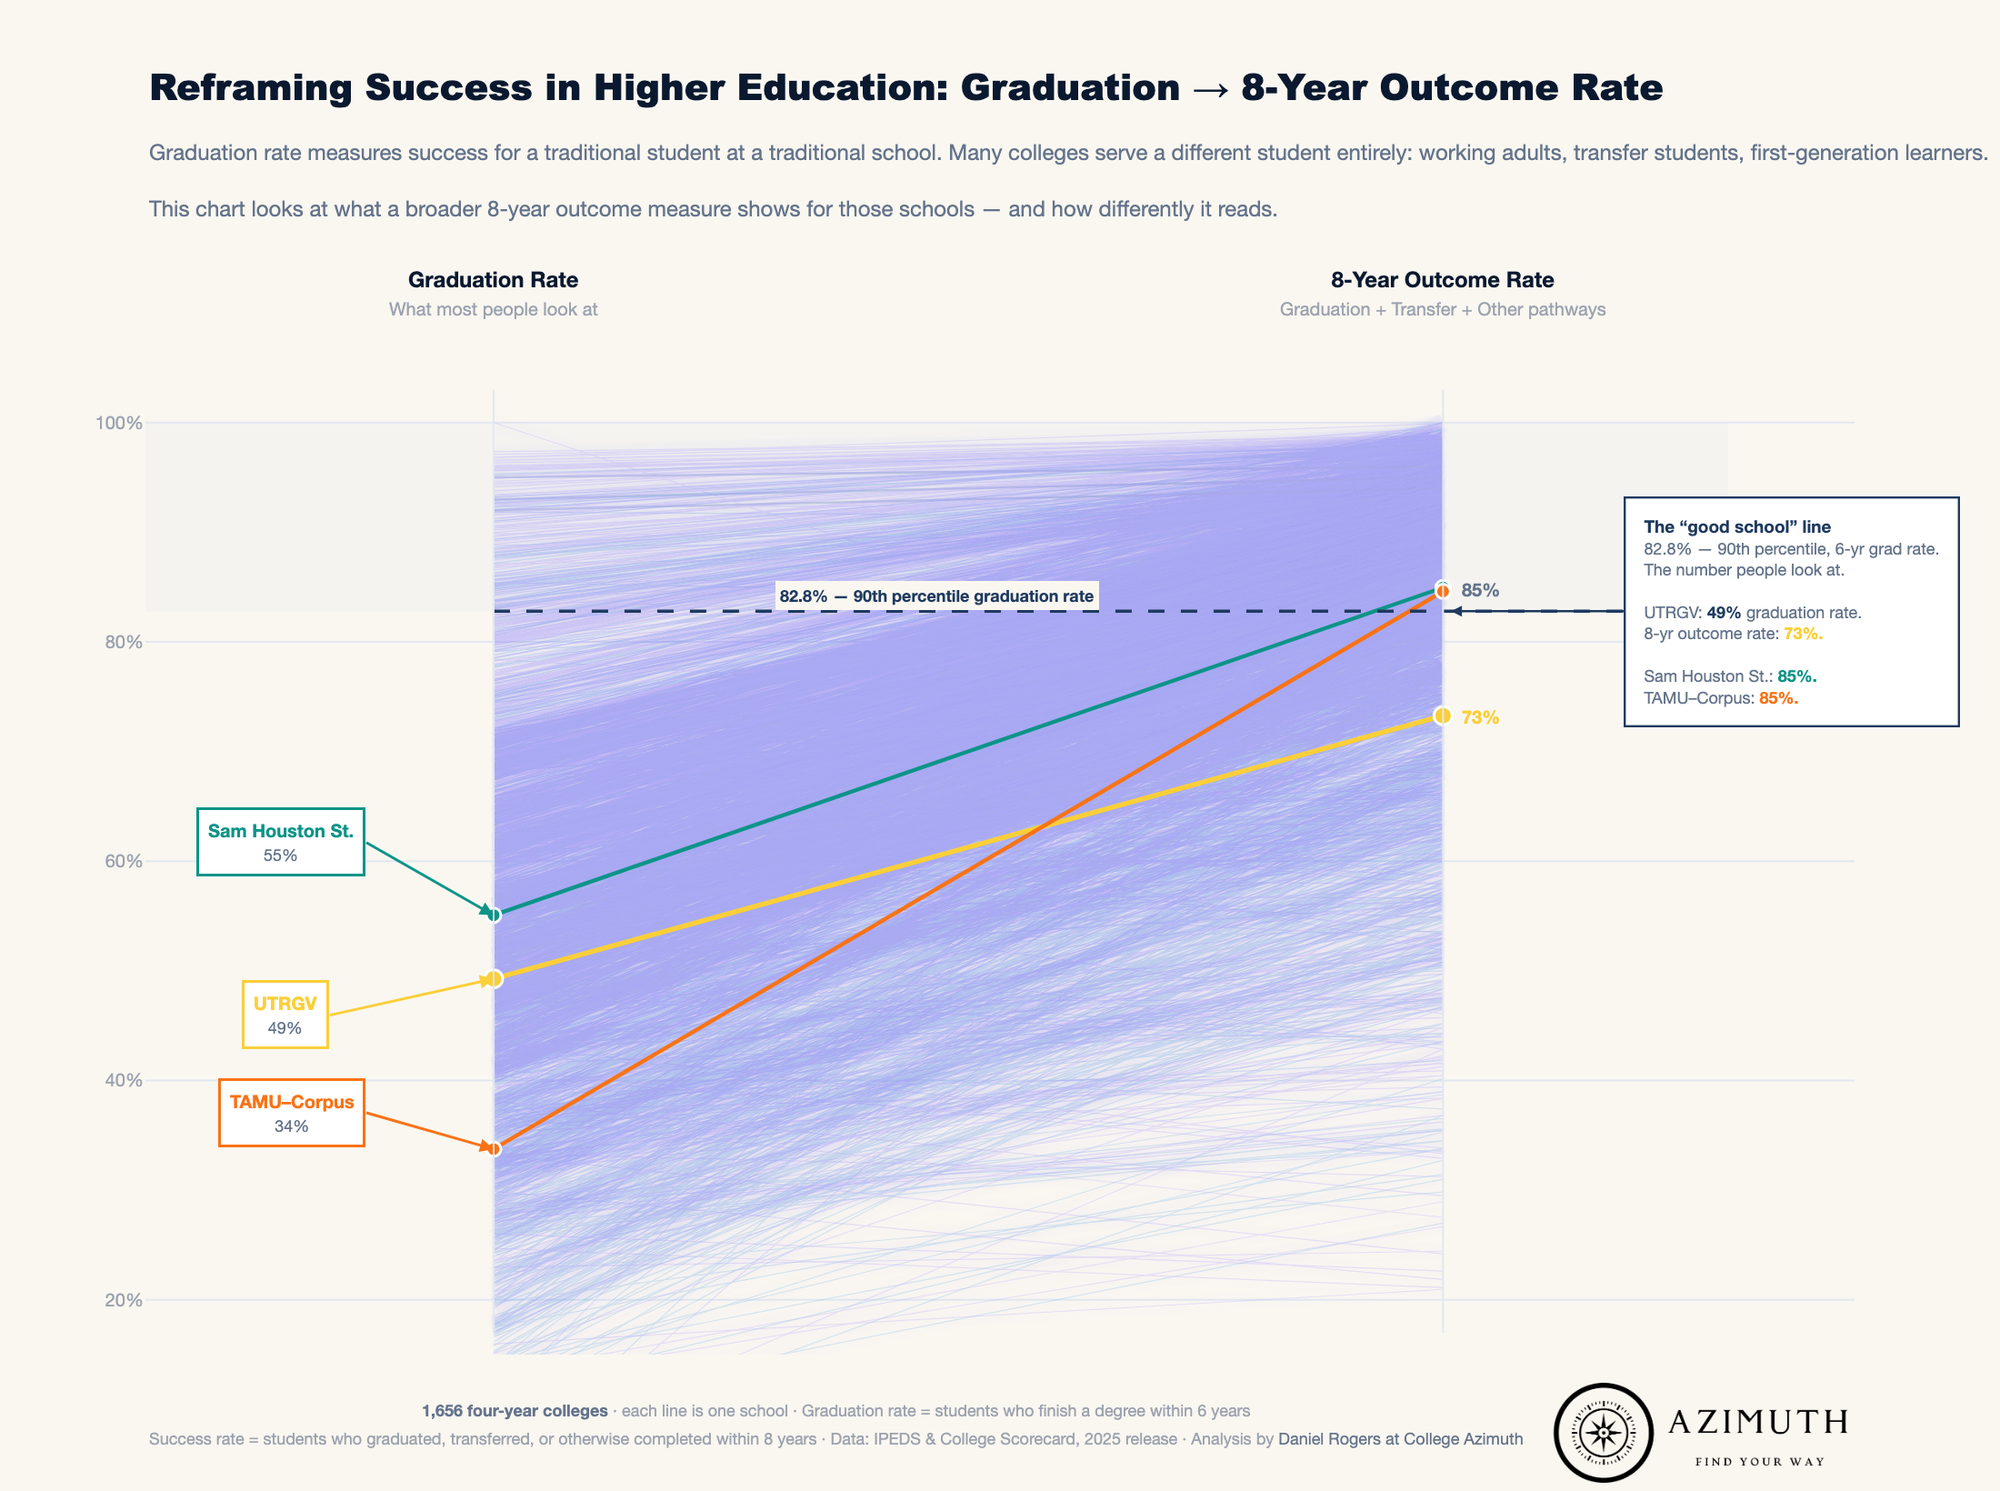
I ran this analysis across every four-year college in our dataset. At 86% of four-year colleges, the traditional graduation rate understates positive outcomes by more than 10 percentage points. The median gap is 26 points.
To put this into perspective I also include the traditional graduation rate the 90th percentile. This is top tier outcomes as we generally might think about it and there are a fair amount of schools who hit that same threshold when you look at the full breadth of what happens.
| Gap between traditional rate and positive outcomes | Share of 4-year colleges |
|---|---|
| More than 10 percentage points | 86% |
| More than 20 percentage points | ~65% |
| More than 30 percentage points | 34% |
At Penn State Abington, the gap is 61.9 points — 22.2% traditional rate, 84.2% positive outcome. Nearly half of Abington students transfer to University Park or another institution; the traditional rate counts every one of them as a failure. At the University of Nebraska Omaha, the gap is 48 points. At CUNY York College in New York, 46.7 points. Different states, different demographics, different institutional missions. Same pattern.
The median four-year school has 15.3% of its students in the status-unknown bucket — the same "Withdrew" category we saw at UTRGV. Even taking the worst-case view on all of them, the median positive outcome rate is dramatically higher than what any ranking shows.
That doesn't mean graduation rates are useless. It means they need context. A 50% graduation rate at a selective residential college and a 50% graduation rate at an open-access commuter school serving working adults are not the same number — even when the digits match.
The job each institution is doing is different, and the metric has to account for that.
Back to the original question.
Back to the question that started this. "What good is looking at earnings if most students don't graduate?"
It's a fair challenge. The answer is that the premise is wrong — not because the graduation rate is lying, but because it's measuring something narrower than most people realize. At UTRGV, 73.3% of students completed a degree or transferred to another institution within eight years. Pell students — the majority of the student body — outperform non-Pell students on completion. The median graduate earns $49,620 ten years out on $12,950 in debt. That's the picture.
The graduation rate isn't the wrong number. It's just not the only number. And for schools that serve working adults, first-generation students, and students who are paying for their education out of their own pockets while they earn it — the schools doing the hardest work in higher education — the traditional metric undersells what's actually happening by about 26 points on average.
One Caveat Worth Naming
The 8-year outcome rate used in this analysis treats transfer as a positive outcome. For many students, it is — transferring from a regional school to a flagship, or from a two-year program to a four-year degree, is often exactly the plan.
But transfer isn't always a success story. A student who leaves in their first semester and re-enrolls somewhere else counts the same as one who completes a credential and moves on intentionally. The metric doesn't distinguish between the two. I'll be unpacking transfer rates fully over the next couple of weeks.
For more on how we factor this into school evaluations, see our methodology.
For more of our analysis, see our main analysis page.